CT Lung Screening Variation

Adoption of low-dose CT lung cancer screening is growing, and that’s a good thing. But rising LDCT utilization is also creating new challenges, illustrated by a new study in JACR that found high variability in radiologist interpretations. 

CT lung screening participation rates are rising, from single digits a decade ago to 19% in a recent survey

  • But there’s still a long way to go to get lung screening to the roughly 75% participation rate seen with breast cancer screening. 

One barrier to getting more people screened is false positives, which can cause patient anxiety and trigger a cascade of additional exams and procedures to work up suspicious findings. 

  • A major contributor to false positives may be variability in how radiologists read CT scans, so the JACR researchers investigated how interpretations for the same images changed between imaging specialists. 

Researchers looked at interpretations made by 1.4k radiologists, each of whom read a minimum of 50 LDCT screening exams (a total of 200k exams), then calculated false-positive rates for both baseline and follow-up exams. Researchers found…

  • High variability in false-positive rates, from 11% to 22%.
  • In random pairs of radiologists, on average, one radiologist would have twice the odds of making a false-positive call as the other. 
  • Radiologists with false-positive rates higher than the median rate also unsurprisingly had higher sensitivity than those below the median (97% vs. 92%).

What’s causing the variation? It could be because some radiologists use image interpretation patterns that increase false positives but also catch more cancers. 

  • In statistical terms, researchers found that for baseline screens read by radiologists who were below the median false-positive rate, they would have about 100 fewer false-positive screens for one fewer true-positive cancer. 

Radiologist variability could be reduced through programs to standardize screening interpretation, such as those implemented in mammography screening.

  • These could include support tools, automated feedback systems, educational interventions, and targeted double reading.

The Takeaway

The new findings on radiologist variability in reading CT lung cancer screening exams illustrate the delicate balance between detecting more cancer at the risk of producing additional false positives. Is the tradeoff worth it? We think we know how most patients would feel.

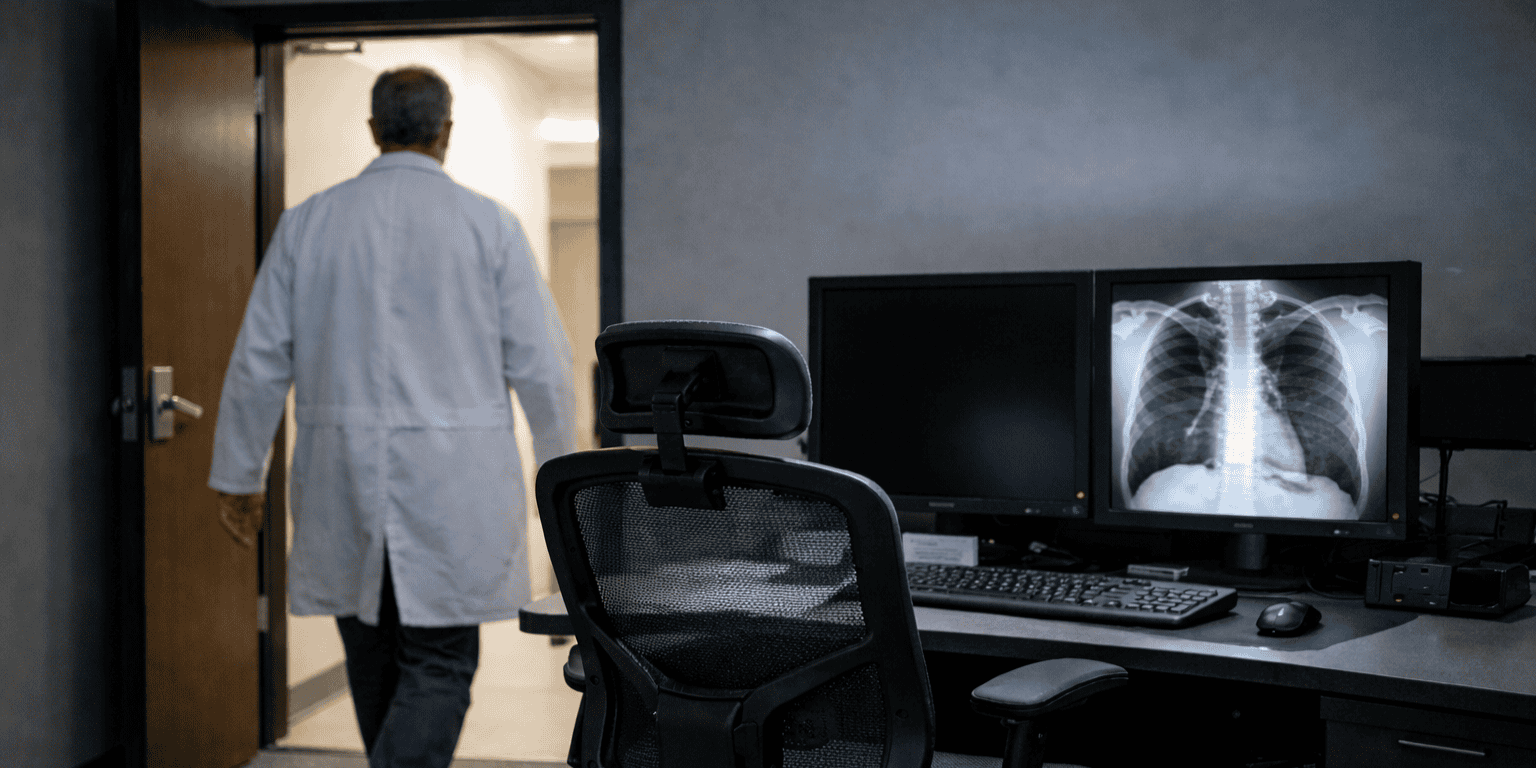
Radiology Report Turnaround Slows

Radiologists are taking longer to interpret medical images than they did 10 years ago … and it’s a problem that appears to be getting worse. New data from the ACR’s Neiman HPI group, published in JACR, show that report turnaround times rose 27% between 2023 and 2024.

Report turnaround time (commonly referred to as TAT) is a closely watched barometer of radiologist productivity, and longer TAT could indicate radiologists are struggling to keep up with growing imaging volumes.

  • Another Neiman HPI study on TAT released earlier this year discovered a “hockey stick” effect, with turnaround times jumping sharply starting in 2022. 

But that study only tracked TAT through 2023. Meanwhile, anecdotal reports have surfaced of a “rapid increase” in turnaround times in late 2024.

  • So the updated research adds more recent data, analyzing newly available Medicare fee-for-service claims from 2024.

Researchers analyzed data from 2.9M office and hospital outpatient claims from 2014 to 2024, finding that TAT…

  • Grew just 14% in seven years from 2014 to 2021 (0.091 to 0.104 days).
  • But then rose at double-digit annual rates in 2023 (60%) and 2024 (27%).
  • Reached 0.251 days by the end of 2024, a 177% increase over 10 years. 
  • Increased at different rates by modality over the 10-year period, including CT (381%), MRI (278%), ultrasound (267%), and X-ray (126%). 

Why did TAT growth decelerate in 2024 over the year before? The Neiman HPI authors weren’t sure, but they said practice leaders may have taken steps to meet higher demand, like moonlighting and reactivating retired staff.

  • But these aren’t long-term measures that can meet the mismatch between supply and demand, suggesting instead that “the radiology workforce may be operating at or near maximum capacity.”

The Takeaway

The new data on slower radiology report turnaround times confirm fears that radiologists are struggling under rising imaging volumes and a stagnant workforce. While slower TAT growth in 2024 is a bit of a silver lining, it does little to hide the growing storm clouds on the horizon.

When Radiologists Quit

The chance that a radiologist would quit their job for a new one doubled over a recent 10-year period. And a new JACR study identifies the exact point in terms of case workload when radiologists are most likely to leave.

The burnout epidemic among healthcare professionals has been closely tied to workload, which has been rising steadily due to growing patient volumes and ongoing staff shortages.

  • In radiology, the problem has been exacerbated as radiologists are reading more images (from more complex cases) while the number of new radiologists being trained in residency programs remains static.

In the new paper, researchers from the ACR’s Neiman HPI investigated changes in radiologist turnover from 2013 to 2022 and how they compared with workload as measured by work relative value units, the most standard measure of physician productivity. 

  • They analyzed data on services provided by 39.4k unique radiologists representing 280.7k radiologist-years over the study period, then correlated that with data on how often radiologists changed practices.

Researchers found…

  • The radiologist turnover rate increased 61% (from 5.3% to 8.5%).
  • Odds of radiologist turnover were nearly 2X in 2022 versus 2013 (OR = 1.96).
  • And were 6% higher for female radiologists and 12% higher for metropolitan versus nonmetropolitan radiologists.
  • While academic radiologists had 9% lower turnover odds than nonacademic imagers.

But what about the connection between workload and turnover? This is where the study gets interesting, as the researchers found a U-shaped relationship between the two.

At low wRVU levels, turnover tended to drop as workload went up, perhaps as radiologists found more job satisfaction (and maybe higher pay) with more work to do.

But this changed once wRVUs hit a threshold, and turnover began rising as well, apparently as radiologists found themselves overworked. This inflection point differed for different types of radiologists…

  • Occurring at 12.9k wRVUs for all radiologists.
  • But at 13.4k wRVUs for private-practice radiologists.
  • And only 8.8k wRVUs for academic radiologists.

The 34% lower wRVU threshold for academic radiologists could be because many have prioritized research and teaching, and see a growing clinical care workload as a distraction without commensurate compensation. 

The Takeaway

The new study offers a fascinating look at the forces driving when and why radiologists quit, and provides a new benchmark showing precisely where the breaking point is for most radiologists. Let’s hope this data is put to good use.  

Managing Incidental Findings Isn’t Impossible

The number of incidental findings on medical imaging scans nearly quadrupled over nine years at a large academic medical center. That’s according to a new JACR analysis that fortunately offers strategies for following up on these unexpected imaging discoveries.

Incidental findings – defined as suspicious areas on medical images that aren’t related to a patient’s chief concern – comprise 15-30% of all medical imaging exams and are a growing challenge in radiology as imaging volume rises. 

  • Radiologists have a responsibility to include incidental findings in their reports, but who’s responsible for making sure patients know about them? 

Healthcare providers have adopted different methods for incidental follow-up, ranging from workflow changes to medical IT solutions.

In the current study, researchers from Northwestern University describe the incidental follow-up system they developed, which worked as follows…

  • An electronic button was embedded in the EMR for radiologists to click when an incidental finding was detected.
  • This relayed a note to the nursing team, which ensured that the patient’s care provider (or the patient themselves) knew about the finding.
  • The system required cases to be resolved when patients were notified of their findings and were told of the next steps to take.

In an analysis covering a total of 25.2k incidental findings from 2015 to 2023, researchers discovered… 

  • The number of findings grew at a compound annual growth rate of 21% with an average of 233 per month. 
  • Annual findings grew from 835 in 2015 to 4k in 2023 – a nearly 4X increase.
  • 99% of findings were resolved. 
  • Cases had to be resolved within seven months of the finding’s discovery.

One caveat is that Northwestern considered the loop closed once the patient was notified of the finding, rather than whether the patient complied with the recommendation.

  • A more robust protocol might involve additional longitudinal tracking to measure downstream effectiveness, which the authors note as a possibility for future research. 

The Takeaway

The new study underscores the stunning growth of incidental findings in radiology. But it also offers hope to imaging facilities through implementation of a simple IT fix and workforce changes that go a long way toward keeping patients notified of their imaging results.

AI for Bone Density Screening with X-Ray

Screening women for osteoporosis using AI analysis of chest X-rays acquired for other clinical indications meets U.S. thresholds for cost-effectiveness. That’s according to a new study in JACR that highlights the potential of radiography AI for opportunistic screening.

Osteoporosis screening is already performed using DEXA scanners that detect bone density loss in women.

  • But DEXA scanners aren’t always available, and dedicated screening for just one condition can be expensive. 

Using AI to analyze chest X-rays that women might be getting for other conditions could expand the pool of women being screened for osteoporosis without incurring significant additional costs.

  • Indeed, Japanese researchers recently published a study honing in on the best techniques for AI-enhanced osteoporosis screening with radiography.

In the new study, researchers performed a modeling analysis that simulated the cost-effectiveness of an osteoporosis screening program based on AI-enhanced chest radiographs for U.S. women aged 50 and up. 

  • The cost analysis compared osteoporosis screening plus treatment versus treatment alone, incorporating standard fracture treatment and imaging costs ($66 for DEXA scans, $20 for chest X-rays).

In a sample of 1k women, AI-enhanced X-ray osteoporosis screening…

  • Had an ICER of $72.1k per QALY, below the U.S. cost-effectiveness thresholds of $100k to $150k per QALY.
  • Would produce healthcare savings of $99k, offset by treatment costs of $208k.
  • Would prevent 2.8 fractures and increase QALYs by 1.5.
  • Would remain cost-effective as long as AI’s cost did not exceed $62 per patient.

Adjusting the model’s parameters produced even better performance for AI-based screening. 

  • If medication adherence improved by 50%, the ICER was reduced to $28.6k.

The Takeaway

The new research offers more support for opportunistic osteoporosis screening, this time perhaps from the most important angle of all: cost-effectiveness. If confirmed with other studies, AI-based bone density analysis could make routine chest X-rays even more valuable.

RadGPT Simplifies Radiology Reports for Patients

When it comes to informing patients of their imaging results, radiologists are caught between a rock and hard place. A new study in JACR shows how generative AI can help by drafting patient-friendly reports that are simple but accurate.

Patients must be informed immediately of their medical results according to a 2021 final rule under the 21st Century Cures Act that prevents medical information blocking. 

  • And while the technology exists to do that through tools like email and electronic patient portals, rapid notification can create confusion because the language physicians use to communicate with each other isn’t easily understood by anyone outside medicine.

Sure, radiology reports could be rewritten manually for patients, who typically read at about the eighth-grade level.

  • But given today’s workforce shortages, who’s going to do that?

Generative AI and large language models offer a solution. In the new JACR paper, researchers from Stanford University led by senior author Curtis Langlotz, MD, PhD, described their development of RadGPT, an LLM designed to improve patient communication.

  • To develop RadGPT, researchers started with OpenAI’s GPT-4 model and the RadGraph concept extraction tool to create an LLM that analyzes patient radiology reports and generates concept explanations and question-and-answer pairs.

How well did RadGPT work? The researchers tested it on 30 radiology reports generated at Stanford from 2012 to 2020, including different modalities and clinical applications. 

  • The LLM was asked to generate reports at a fifth-grade reading level (the level recommended by the Joint Commission for patient-facing healthcare materials).

Five radiology-trained physicians then rated the quality of RadGPT’s responses, finding …

  • The average rating of RadGPT-generated concept explanations was 4.8 out of 5.
  • 95% of concept explanations had an average rating of 4 or higher.
  • 50% of concept explanations were rated 5, the highest possible rating.
  • Questions and answers generated by RadGPT were also rated highly, with an average rating of 3.0 on a three-point scale..

The Stanford researchers told The Imaging Wire that their goal is to make RadGPT more widely available as part of a prospective evaluation with real patients.

  • They are also developing a user-friendly interface in which patients can receive hyperlinked radiology reports.

The Takeaway

RadGPT and solutions like it fill a desperate need for tools that can save time for radiologists while helping patients better understand their reports and get more engaged in their care. The next step is to get technology like this into the hands of practicing radiologists.

Imaging Workload Jumps with Higher Use of CT, MRI

Radiology’s shift to more advanced modalities like CT and MRI is increasing the burden on radiologists to interpret more complex exams. A new study in JACR documents the trend, finding that radiologist workload for inpatient imaging has risen sharply over the last 10 years. 

Like many physicians, radiologists are feeling burned out from rising patient workload, personnel shortages, and declining reimbursement. 

  • But radiology has the added burden of being one of healthcare’s most technology-focused specialties, with new imaging modalities giving them cooler tools to work with, but at the cost of steadily increasing exam complexity.

Researchers from Brigham and Women’s Hospital have been tracking inpatient imaging utilization for the past 40 years, and the new paper provides the latest update. 

  • They calculated inpatient imaging volume at Brigham and Women’s from 2012 to 2023, during which 896k imaging exams were performed.  

Results for the study were as follows …

  • Total annual inpatient imaging volume grew 17% over 10 years (102k to 119k exams).
  • Total imaging exams per patient admission (adjusted by case mix and disease severity) fell 20% due to declines in X-ray, ultrasound, and nuclear medicine.
  • But imaging exams per patient admission grew for CT (19%) and MRI (21%).
  • Leading to growth in CT and MRI’s combined share of all radiology global RVUs (62% to 75%).
  • Hospital length of stay rose 32% (5.6 to 7.4 days), possibly due to the COVID-19 pandemic. 

What does it all mean? Basically, the number of inpatient imaging exams per patient is declining when adjusted for disease severity, but radiologists are still having to work harder because the studies are more complex. 

  • Imaging could also be shifting from the inpatient setting to outpatient centers due to reimbursement changes aimed at shifting exams to lower-cost settings than hospitals.

One big question with the new study is the degree to which the COVID-19 pandemic skewed the results compared with previous years. 

  • The pandemic may have spurred more use of CT, especially given its value in providing a definitive diagnosis of SARS-CoV-2 infection. 

The Takeaway

If you feel like you’re working harder than ever, the new findings show that you’re not crazy. And given radiology’s breakneck pace of innovation, it’s not likely the trends revealed in the new study will let up any time soon.

Forecasting Radiologist Supply

Two new studies published this week in JACR raise the provocative question: Will there be a radiologist shortage in the future given growing demand for medical imaging services?

It’s a question that’s become commonplace across healthcare as burnout and other issues prompt many physicians to leave the field. 

  • This has caused workforce shortages that raise questions about whether the U.S. – and other advanced economies – will be able to meet growing demand for healthcare services by an aging population.

The new studies were conducted by Harvey L. Neiman Health Policy Institute researchers and each tackles one aspect of the supply/demand equation over the next 30 years. 

The first study analyzed past growth in the radiologist workforce to find …

  • There were 37.5k radiologists enrolled to provide care to Medicare patients in 2023. 
  • With no growth in the number of residency positions, there will be 47.1k radiologists in 2055, an increase of 26%.
  • If residency positions grow, there will be 52.6k radiologists, an increase of 40%.

The wildcard here is growth in residency positions, which are mostly controlled by Medicare through its graduate medical education program – and it literally takes an act of Congress to increase the number of trainee positions. 

  • Another factor is whether the higher physician attrition rate seen during the COVID-19 pandemic continues into the future. 

The second study addressed growth in imaging volume by analyzing trends in claims data for Medicare, Medicaid, and private insurance, finding …

  • Imaging utilization will be 17-27% higher by modality by 2055 assuming no continuation of recent utilization trends.
  • Most utilization growth will be seen in nuclear medicine (27%), CT (25%), interventional radiology (23%), X-ray (18%), and MRI and ultrasound (17% each).
  • Adding recent utilization trends to the model finds utilization by 2055 either -5.6% lower or up by 45%.

Factors affecting future utilization include population growth (73-88% of increase) and population aging (12-27%). 

The Takeaway

So will there be a radiologist shortage in the future? The new studies indicate that there are too many variables to make an accurate prediction right now. But they do provide a foundation for future research – and debate. 

Radiologist Salaries Lag Inflation

A new study in JACR confirms what many radiologists have suspected: salary growth for private-practice radiologists has lagged inflation over the last 10 years. While there were a few bright spots, the study mostly shows that radiologists are working harder for less pay. 

Radiology has long been one of the better-compensated medical specialties, often landing in the top 10 of disciplines with the highest average annual compensation. 

  • But radiology has also been a target for reimbursement cuts by the U.S. government as it tries to shift more Medicare and Medicaid payments to primary care practitioners.

As a result, previous studies have found that payments per Medicare beneficiary in radiology have actually declined. 

  • And another 2.83% cut is on the docket for 2025 unless Congress steps in before the end of the current legislative session to prevent cuts in the 2025 Medicare Physician Fee Schedule.

The new study analyzes radiologist compensation based on MGMA salary survey data from 2014 to 2023. 

  • Researchers compared salaries for both diagnostic and interventional radiologists, and also between private-practice and academic radiologists. 

Based on the data, they found …

  • Diagnostic radiologists saw median total compensation grow over the survey period, but at a faster rate for academic radiologists (32% vs. 18%). 
  • Academic radiologists enjoyed faster annualized salary growth (3.2% vs. 1.9%) and had an edge after adjustment for inflation (+0.3% vs. -1%).
  • Work RVUs (a measure of productivity) also grew but at a slightly higher rate for academic radiologists (21% vs. 20%). 
  • Interventional radiologists saw higher salary growth for both non-academic and academic physicians (41% and 35%). 

The findings indicate that the traditional salary gap between private-practice and academic radiologists may be narrowing.

  • The growth in wRVUs in a time of stagnant or declining salaries after inflation adjustment may confirm the suspicions of both types of radiologists: that they are working harder for less pay. 

The Takeaway

The findings could be a gut punch for private-practice diagnostic radiologists, who are finding that their salary gains aren’t keeping pace with inflation (sound familiar?). They also suggest that academic radiology could offer a refuge from the market and government forces that are reshaping the private sector.

Do Imaging Costs Scare Patients?

A new study in JACR reveals an uncomfortable reality about medical imaging price transparency: Patients who knew how much they would have to pay for their imaging exam were less likely to complete their study. 

Price transparency has been touted as a patient-friendly tool that can get patients engaged with their care while also helping them avoid nasty billing surprises for out-of-pocket costs. 

  • Price transparency is considered to be so important that CMS in 2021 implemented rules requiring hospitals to disclose their standard charges online, as well as post a user-friendly list of their services that includes prices. 

But given that the rules were implemented relatively recently, not much is known about how they might affect patient behavior, such as compliance with recommended follow-up imaging exams.

  • Indeed, a recent study by some of the same authors found that patients are largely unaware of how much their imaging exams will cost them. 

So researchers analyzed data from two previously published studies of patients who either completed or were scheduled for outpatient imaging exams in Southern California. 

  • Patients were asked if they had been told how much their exam would cost them out-of-pocket when they scheduled it. 

Of the 532 patients who were surveyed, researchers found …

  • Only 15% said they knew about their out-of-pocket costs before their imaging exam. 
  • Fewer patients who completed their exams knew their costs compared to those who canceled (12% vs. 22%).
  • Patients who knew their costs were 67% less likely to complete their appointment than those who didn’t (OR=0.33).

So what’s the solution? The researchers suggested that healthcare providers may need to take a more proactive approach to disclosing price information to patients.

  • One possibility would be to integrate pricing discussions into patient-provider communications when ordering imaging exams, rather than relying on patients to seek pricing information on their own. 

The Takeaway

The findings show that medical imaging price transparency is more complicated than just posting a list of prices online and expecting patients to do the rest of the work. Imaging providers may need to get more involved in pricing discussions – the question is whether many of them are ready for it.

Get every issue of The Imaging Wire, delivered right to your inbox.